Read a YouTube retention graph without guessing at the cause
Use dips, spikes, and the opening as investigation points, then compare the graph with the actual content and viewer expectation.
The quick answer
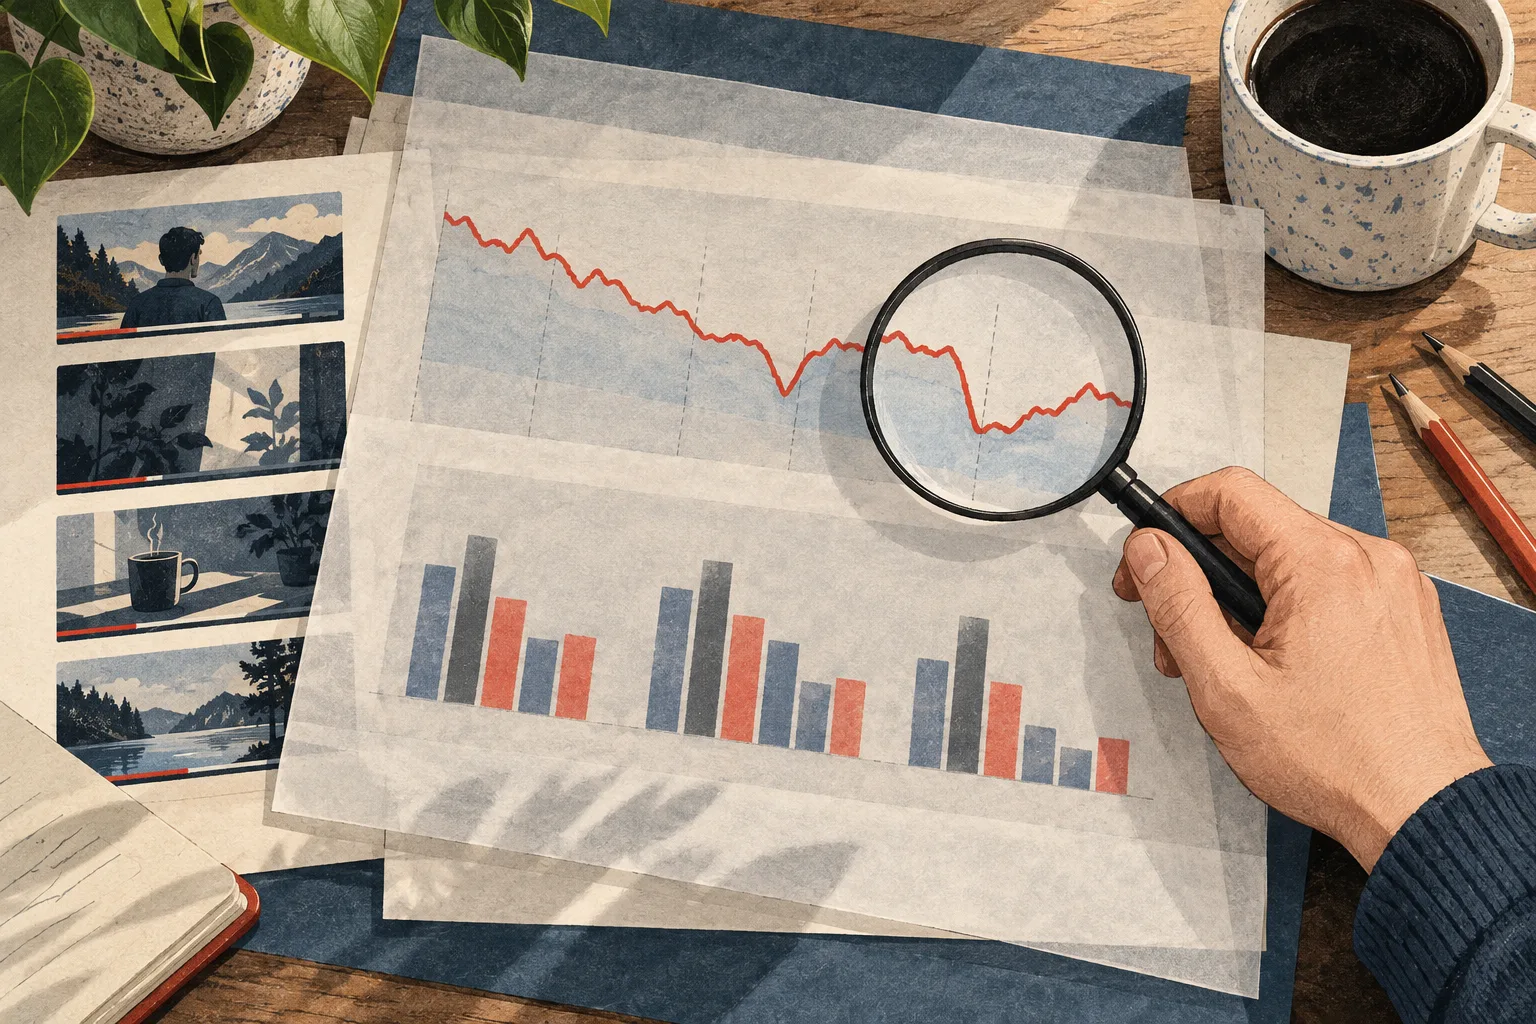
A retention graph shows where viewing behavior changes, but it does not explain the cause by itself. Rewatch the relevant moments, compare them with the video's promise and audience context, and form a specific editing hypothesis before changing your next script.
In this guide
Start with the promise and audience
Before studying the curve, write what the title and thumbnail led viewers to expect. A graph cannot tell you whether the video attracted people who wanted a quick answer, a detailed explanation, or a story.
That distinction matters. A viewer leaving after receiving a concise answer may represent a different outcome from someone leaving because the opening did not match the promise. Both can appear as departures on a chart.
Inspect the opening
Look for delayed proof, repeated setup, unclear audio, or missing context. Compare the first meaningful demonstration with what the packaging promised.
Use YouTube's retention report documentation to interpret the report's terms. Then return to the actual footage. A label or graph shape is a starting point for investigation, not a complete explanation.
Examine dips with alternative explanations
A dip near a long equipment list may suggest that viewers wanted the demonstration sooner. It could also reflect a chapter jump or a section irrelevant to one part of the audience.
Write at least two plausible explanations before choosing an edit. Then look for supporting evidence: repeated comments, similar patterns in related videos, or an obvious mismatch in the script.
Avoid cutting a necessary explanation simply because it coincides with a decline. You may need to move it, shorten it, or demonstrate it more clearly instead.
Interpret spikes carefully
A spike can indicate a compelling moment, replaying, or confusion that caused viewers to watch again. Rewatch the section and ask whether the content is especially useful or difficult to follow.
For a software tutorial, a spike at a fast settings change may mean viewers needed another look. The next video might benefit from a stable shot and a clearer label, even though the spike initially looked like evidence that the pacing was excellent.
Compare relevant videos
Choose videos with similar formats, lengths, and viewer intentions. A detailed tutorial and a short personal update create different expectations. Do not force their curves into one universal ideal shape.
Look for patterns across your own uploads. If several videos lose attention during the same kind of repeated introduction, you have a stronger editing hypothesis than one isolated dip provides.
Create a retention review note
| Moment | Observation | Possible explanation | Next test |
|---|---|---|---|
| Opening | Decline before the first example | Promise takes too long to become concrete | Start with a brief demonstration |
| Middle | Replays around a settings change | Action may be difficult to follow | Hold the screen and label the setting |
| Ending | Viewers leave after the answer | Main task may be complete | Make the next step relevant and concise |
Use your actual observations and keep the explanations provisional.
Turn the finding into a script change
Bring the title, opening, and review note into Vidfora's Coach or your own editing process. Ask for a targeted revision that addresses the hypothesis while preserving the evidence.
The goal is not a perfectly flat graph. It is a video that serves the intended viewer more clearly and a review process that teaches you something specific enough to apply.
Common questions
Does a retention spike mean viewers loved that section?
It may, but replaying can also happen because a section was unclear or information passed too quickly. Inspect the content and surrounding context before deciding what the spike means.
Can I see another channel's retention graph?
Not from public video statistics. Retention is private analytics unless the owner shares or authorizes access. Public outlier research cannot substitute for that data.
Published by Vidfora, the product discussed in these guides. Examples are illustrative unless a source is named. Editorial approach · Suggest a correction